Real Estate Market Update – Home Sales and Property Prices in El Segundo in October
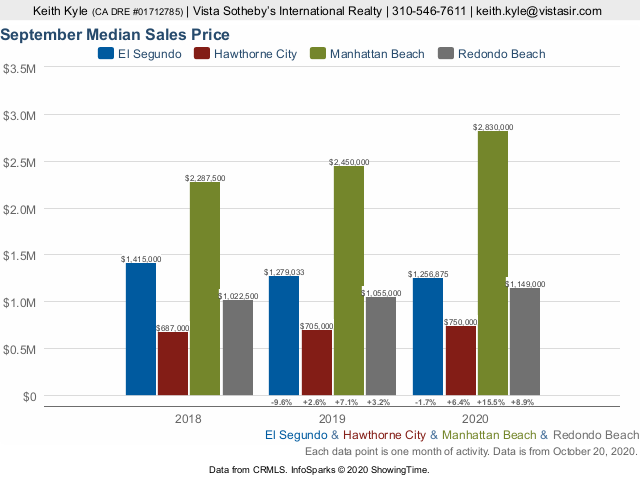
October was another solid month for real estate in El Segundo CA. There were 13 home sales in this coastal community which was a solid number although much lower than the record month of September 2020 with 20 homes selling in El Segundo. The median “list” price was $1,469,000 with the median “sold” price of $1,469,000 meaning that homes basically sold for full price. The average price per foot was $714 and the average days on market was 52.
View the current home sales in El Segundo
October Home Sales in El Segundo
| Type | Address | Price | $ Per Foot | Bed/Bath | Sq Feet | Year | Sold Date | |
| CONDO/A | 900 | Cedar #310 | $686,000 | $582.84 | 2/2,0,0,0 | 1177/A | 1978/ASR | 10/19/2020 |
| TWNHS/A | 580 E | Imperial AVE | $885,990 | $712.78 | 2/2,0,1,0 | 1243/B | 2018/BLD | 10/27/2020 |
| TWNHS/A | 708 | Virginia ST | $1,149,000 | $623.44 | 3/1,1,1,0 | 1843/B | 2007/ASR | 10/22/2020 |
| SFR/D | 1468 | Elin Pointe DR | $1,199,000 | $607.70 | 3/3,0,0,0 | 1973/A | 2004/ASR | 10/9/2020 |
| SFR/D | 1524 E | Mariposa AVE | $1,279,000 | $671.39 | 3/2,0,0,0 | 1905/A | 1947/ASR | 10/6/2020 |
| SFR/D | 316 | Loma Vista ST | $1,463,000 | $599.84 | 5/4,0,0,0 | 2439/A | 1954/ASR | 10/1/2020 |
| TWNHS/A | 127 | W Palm Ave | $1,469,000 | $726.87 | 4/3,0,0,0 | 2021/B | 2020/BLD | 10/15/2020 |
| TWNHS/A | 131 W | Palm AVE | $1,470,000 | $772.87 | 4/3,0,0,0 | 1902/B | 2020/ASR | 10/21/2020 |
| SFR/D | 760 | Yucca ST | $1,530,000 | $712.62 | 3/2,0,0,0 | 2147/A | 1969/ASR | 10/1/2020 |
| SFR/D | 758 | Bayonne ST | $1,550,000 | $1,212.83 | 3/2,0,0,0 | 1278/A | 1924/ASR | 10/13/2020 |
| SFR/D | 529 | Hillcrest ST | $1,675,000 | $892.86 | 4/2,1,0,0 | 1876/A | 1949/ASR | 10/7/2020 |
| SFR | 924 | Camber LN | $1,942,000 | $652.77 | 4/3,0,1,0 | 2975/B | 2019/SLR | 10/22/2020 |
| SFR/D | 840 | Sheldon ST | $2,200,000 | $524.06 | 5/3,0,0,2 | 4198/AP | 2009/PUB | 10/13/2020 |