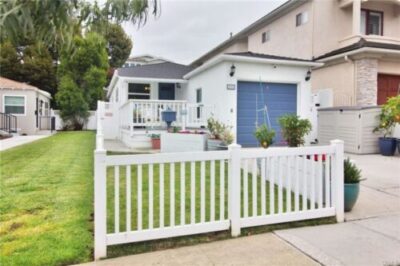
see the homes that sold in El Segundo during october
October was a slower month for home sales in El Segundo CA with only 7 on market property sales closing. The average “list” price was $1,167,357 with the average “sold” price at $1,170,857 meaning that homes generally sold higher than the asking price. Average days on market was a very short 32 before going into escrow and the average price per foot was $885. See how this compares with other months on our El Segundo real estate statistics and trends page.
View the current homes for sale in El Segundo CA

October 2021 Home Sales and Prices in El Segundo California
| Type | Address | Price | $ Per Foot | Bed/Bath | Sq Feet | Year | Sold Date | |
| TWNHS/A | 770 W | Imperial AVE #46 | $580,000 | $491.53 | 2/1,0,1,0 | 1180/P | 1966/PUB | 10/8/2021 |
| TWNHS/A | 310 W | Imperial AVE #8 | $745,000 | $559.73 | 2/2,0,1,0 | 1331/A | 1979/ASR | 10/18/2021 |
| CONDO/A | 215 W | Palm AVE #104 | $822,000 | $723.59 | 2/2,0,0,0 | 1136/P | 1981/PUB | 10/1/2021 |
| TWNHS/A | 1345 E | Grand AVE #D | $925,000 | $679.15 | 3/2,0,1,0 | 1362/P | 1989/PUB | 10/1/2021 |
| SFR/D | 402 E | Sycamore AVE | $1,600,000 | $1,496.73 | 3/1,0,0,0 | 1069/A | 1948/PUB | 10/20/2021 |
| SFR/D | 517 W | Mariposa AVE | $1,630,000 | $1,069.55 | 3/0,2,0,0 | 1524/A | 1952/ASR | 10/20/2021 |
| SFR/D | 759 | Sheldon ST | $1,894,000 | $1,174.94 | 3/2,0,0,0 | 1612/P | 1975/PUB | 10/25/2021 |
