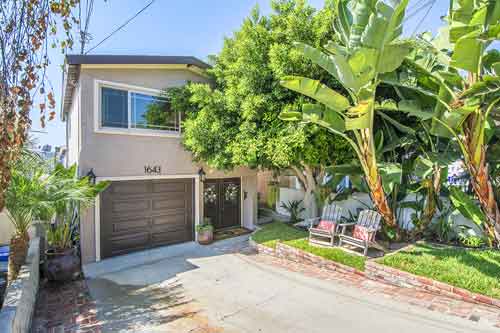
see the homes that sold in El segundo during September 2022
It was a somewhat slower month for the number of homes that sold in El Segundo with 9 SFR, townhome and condo sales.
The average “list” price was $1,452,656 with the average sold price for El Segundo homes that closed at $1,408,833 meaning that homes generally sold below the list price. The average price per foot for sold homes was $805. Homes averaged an astounding 9 days on market before going into pending status.
See how that compares with other months on our El Segundo real estate trends and statistics page.

September 2022 Home Prices in El Segundo
| Type | Address | Price | $ Per foot | Bed/Bath | Sq Feet | Year | |
| CONDO/A | 215 W | Palm AVE #102 | $735,000 | $647 | 2/2,0,0,0 | 1136/A | 1981/ASR |
| CONDO/A | 745 | Main ST #106 | $750,000 | $639 | 2/1,1,0,0 | 1173/A | 1977/ASR |
| TWNHS/A | 1373 E | Grand AVE #E | $1,060,000 | $716 | 3/2,0,1,0 | 1480/A | 1989/ASR |
| TWNHS | 535 E | Walnut AVE #A | $1,125,000 | $697 | 2/2,0,1,0 | 1613/ | 1989 |
| TWNHS/A | 221 | Whiting ST #2 | $1,143,000 | $678 | 3/2,1,1,0 | 1685/A | 1992/ASR |
| DPLX/D | 423 W | Maple AVE | $1,771,500 | $1,074 | 4/2,0,0,0 | 1649/A | 1912/ASR |
| TPLX/D | 834 | Penn ST | $1,835,000 | $1,023 | 4/3,0,0,0 | 1793/A | 1943/ASR |
| SFR/D | 905 | Dune ST | $2,060,000 | $862 | 4/3,0,0,0 | 2390/A | 1979/PUB |
| SFR/D | 540 | Richmond ST | $2,200,000 | $915 | 4/4,0,0,0 | 2405/A | 1988/ASR |
This web site may reference real estate listing(s) held by a brokerage firm other than the broker and/or agent who owns this website. The accuracy of all information is deemed reliable but not guaranteed and should be personally verified through personal inspection by and/or with the appropriate professionals.
