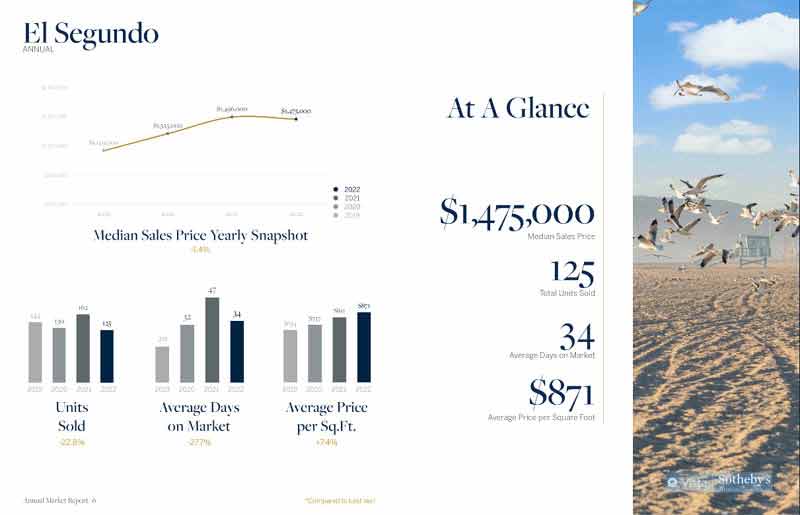
The Top Home Sale of the Month in El Segundo – 710 Sycamore Closes at $2,285,000

It was a big month for home sales in El Segundo CA with 20 homes selling during the month. Compare that with only 6 sales (which is low but closer to normal) in September 2019 and you get a sense of what a big month it was. The median price of the homes that sold was an impressive $1,420,000. Equally impressive was the short 25 days on the market before selling compared with 47 a year earlier.
View the current homes for sale in El Segundo CA.
| Type | Address | Price | $ Per Foot | Bed/Bath | Sq Feet | Year | |
| CONDO | 770 W | Imperial AVE #71 | $547,000 | $544.28 | 2/2,0,0,0 | 1005/ | 1966 |
| CONDO/A | 818 | Main ST #101 | $729,000 | $518.49 | 2/2,0,0,0 | 1406/A | 1979/ASR |
| TWNHS/A | 1325 E | Grand AVE #D | $860,000 | $633.75 | 3/3,0,0,0 | 1357/A | 1989/ASR |
| TWNHS/A | 224 W | Imperial AVE | $902,000 | $601.33 | 3/2,0,1,0 | 1500/A | 2005/ASR |
| TWNHS/A | 1629 E | Palm AVE #8 | $922,200 | $574.58 | 3/2,0,1,0 | 1605/A | 1991/ASR |
| TWNHS/A | 594 E | Imperial AVE | $959,990 | $546.07 | 3/3,0,1,0 | 1758/B | 2018/BLD |
| TWNHS/A | 512 E | Imperial AVE | $989,990 | $563.13 | 3/3,0,1,0 | 1758/B | 2018/BLD |
| TWNHS | 1700 E | Mariposa AVE #4 | $1,075,000 | $632.35 | 3/2,0,1,0 | 1700/ | 2013 |
| TWNHS/A | 540 E | Imperial AVE | $1,105,000 | $561.20 | 3/3,0,1,0 | 1969/B | 2018/BLD |
| TWNHS/A | 360 | Richmond ST | $1,188,750 | $675.04 | 3/4,0,0,0 | 1761/A | 2000/ASR |
| SFR/D | 832 | Bungalow DR | $1,325,000 | $968.57 | 3/2,0,0,0 | 1368/A | 1943/ASR |
| SFR/D | 745 | Virginia ST | $1,470,000 | $893.07 | 3/2,0,1,0 | 1646/A | 1924/ASR |
| SFR/D | 422 E | Maple AVE | $1,659,000 | $614.67 | 5/3,0,0,0 | 2699/A | 1975/ASR |
| SFR/D | 1543 E | Palm | $1,900,000 | $894.96 | 3/2,0,1,0 | 2123/A | 2016/BLD |
| SFR/D | 720 W | Pine AVE | $1,950,000 | $958.23 | 3/2,0,1,0 | 2035/D | 1962/APP |
| SFR/D | 811 | California ST | $1,990,000 | $700.70 | 4/4,0,1,0 | 2840/A | 1997/ASR |
| SFR/D | 825 | Center ST | $2,055,000 | $772.56 | 4/3,0,0,0 | 2660/B | 1943/ASR |
| SFR/D | 539 | Loma Vista | $2,240,000 | $734.91 | 4/2,2,0,0 | 3048/A | 2011/ASR |
| SFR/D | 610 W | Pine AVE | $2,240,000 | $635.82 | 5/3,0,1,0 | 3523/AP | 1956/ASR |
| SFR/D | 710 W | Sycamore AVE | $2,285,000 | $668.72 | 4/4,0,0,0 | 3417/A | 2015/ASR |
From El Segundo MLS, Vista Sotheby’s International and realtor Keith Kyle, we wanted to wish you a very happy and safe 2021 Labor Day weekend.

Take a look at the homes that sold in El Segundo during the month of August. It was a bit of a slow month with 60 homes sold during the month. See below for the homes that sold in August, home prices, price per foot and more.
Take a look at the current homes for sale in El Segundo or sign up for FREE listing alert emails.
|
Type
|
Address |
Price
|
$ Per Sq Feet
|
Bed/Bath
|
Sq Feet
|
Year Built
|
Sold Date
|
|
|
CONDO/A
|
935
|
Main ST #104 |
$785,000
|
$590.67
|
2/2,0,0,0
|
1329/A
|
1981/PUB
|
8/7/2020
|
|
TWNHS/A
|
1710 E
|
Mariposa AVE #2 |
$1,045,000
|
$614.71
|
3/3,0,0,0
|
1700/A
|
2013/ASR
|
8/28/2020
|
|
SFR/A
|
509
|
Eucalyptus DR |
$1,525,000
|
$788.52
|
3/1,1,1,0
|
1934/A
|
1985/ASR
|
8/28/2020
|
|
SFR/D
|
912
|
Sheldon |
$1,665,000
|
$661.76
|
4/3,0,1,0
|
2516/A
|
1948/ASR
|
8/4/2020
|
|
SFR/D
|
526
|
Whiting ST |
$1,780,000
|
$659.26
|
5/2,0,2,0
|
2700/O
|
1912/ASR
|
8/13/2020
|
|
SFR/D
|
225 W
|
Sycamore AVE |
$1,800,000
|
$885.83
|
4/3,0,0,0
|
2032/A
|
1952/ASR
|
8/31/2020
|
|
SFR/D
|
321
|
Lomita ST |
$2,511,875
|
$829.28
|
5/4,0,1,0
|
3029/A
|
2018/PUB
|
8/19/2020
|