El Segundo January Real Estate Recap

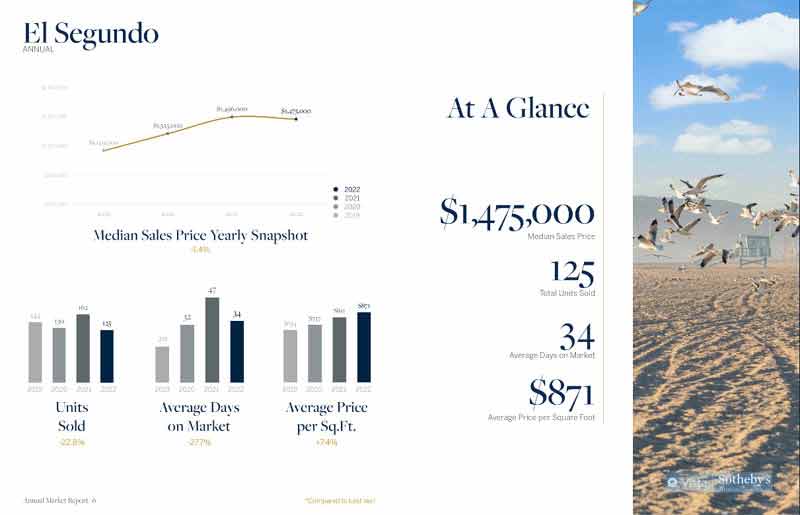
Lets’s see how the real estate market got started in 2022. Take a look below at the homes, townhomes and coondos that sold in El Segundo during the month of January. It was a good month for closed home sales in El Segundo with 9 on MLS homes closing escrow during the month. The average “list” price was $1,441,656 with the average sold price at $1,471,667 meaning that, in general, homes sold well higher than the list price. The average price per foot was $757 and median days on market was 29. See how that compares with other months on our El Segundo real estate market trends and statistics page.
Search the current homes for sale in El Segundo
| Type | Address | Price | $ Per Foot | Bed/Bath | Sq Feet | Year | Sold Date | |
| CONDO/A | 770 W | Imperial AVE #49 | $580,000 | $ 577 | 2/2,0,0,0 | 1005/P | 1966/PUB | 1/20/2022 |
| TWNHS/A | 216 | Loma Vista ST #C | $1,035,000 | $ 727 | 3/3,0,0,0 | 1423/P | 1990/PUB | 1/12/2022 |
| TWNHS | 1225 E | Grand AVE #F | $1,060,000 | $ 675 | 2/2,0,0,0 | 1570/ | 2006 | 1/11/2022 |
| TWNHS/A | 215 | Whiting ST #3 | $1,075,000 | $ 691 | 3/3,0,1,0 | 1555/A | 1992/ASR | 1/4/2022 |
| TWNHS | 1225 E | Grand AVE #H | $1,170,000 | $ 661 | 2/2,0,1,0 | 1770/ | 2006 | 1/26/2022 |
| TWNHS/A | 1700 E | Mariposa AVE #2 | $1,245,000 | $ 773 | 3/2,0,1,0 | 1610/A | 2013/PUB | 1/25/2022 |
| SFR | 1428 E | Elm AVE | $1,780,000 | $ 1,221 | 3/3,0,0,0 | 1458/ | 1954/ASR | 1/13/2022 |
| SFR/D | 717 | Virginia ST | $2,200,000 | $ 805 | 3/2,1,0,0 | 2733/A | 1914/ASR | 1/24/2022 |
| SFR/D | 360 | Hillcrest ST | $3,100,000 | $ 686 | 4/4,0,0,0 | 4518/A | 1991/PUB | 1/25/2022 |
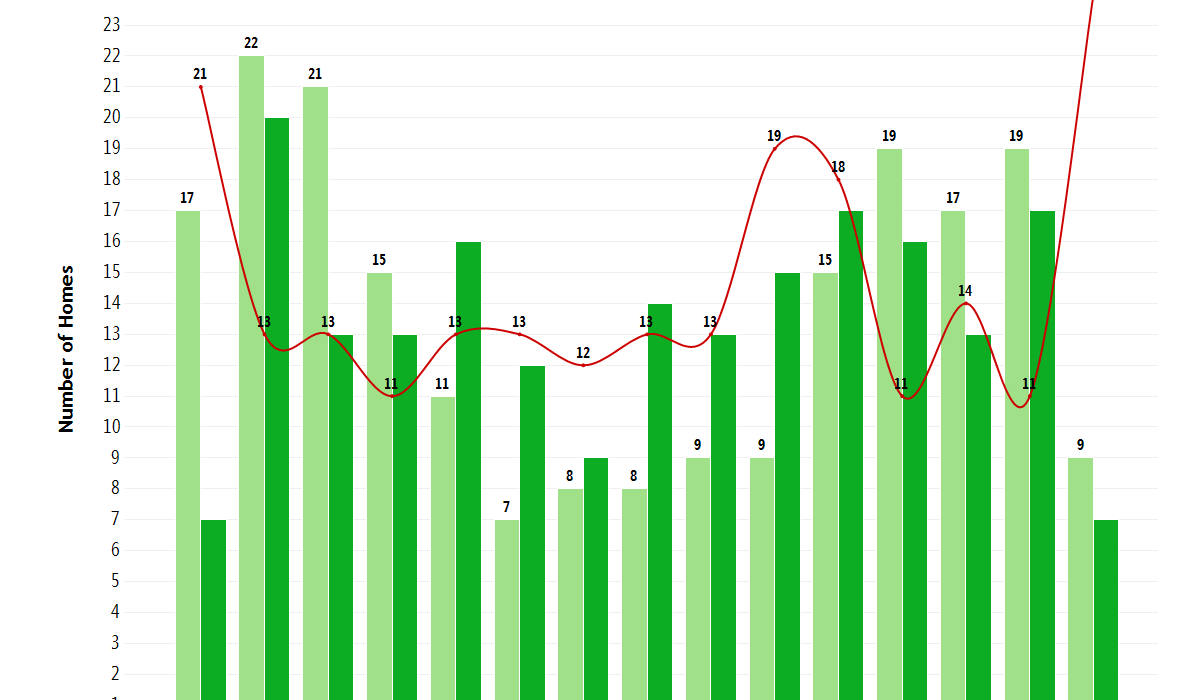
As housing inventory remains very low in El Segundo, this latest month will really deplete the number of active MLS listings with a huge jump in pending home sales. October saw 24 homes go into escrow which is the highest number we could track within the last 10 years. With active listings at a near record low (7 as of 11/11) this doesn’t bode well for home buyers eager to find a home in this charming South Bay community. View the active MLS listings and El Segundo homes here.
It was a great month for home sales in El Segundo CA with 13 on market home sales. The average list price was $1,314,031 with the average sales price of $1,330,531. Homes averaged 21 days on market before going into escrow. See how this compares with other months on our El Segundo real estate trends and statisics page.
View the current homes for sale in El Segundo CA
| Type | Address | Price | $ Per Foot | Bed/Bath | Sq Feet | Year | Sold Date | |
| CONDO/A | 770 W | Imperial AVE #2 | $434,900 | $610.81 | 1/1,0,0,0 | 712/A | 1966/PUB | 8/27/2021 |
| CONDO/A | 770 W | Imperial AVE #62 | $550,000 | $565.26 | 2/2,0,0,0 | 973/A | 1966/ASR | 8/30/2021 |
| CONDO/A | 950 | Main ST #203 | $650,000 | $553.19 | 2/2,0,0,0 | 1175/A | 1982/ASR | 8/26/2021 |
| CONDO/A | 950 | Main ST #302 | $700,000 | $595.74 | 2/2,0,0,0 | 1175/E | 1982/EST | 8/11/2021 |
| CONDO/A | 900 | Cedar ST #5 | $725,000 | $615.97 | 2/1,1,0,0 | 1177/A | 1978/ASR | 8/6/2021 |
| CONDO/A | 950 | Main ST #103 | $750,000 | $638.30 | 2/1,1,0,0 | 1175/P | 1982/PUB | 8/27/2021 |
| SFR/D | 510 | Oregon ST | $1,365,000 | $1,050.81 | 3/2,0,0,0 | 1299/A | 1953/ASR | 8/19/2021 |
| TWNHS/A | 366 | Richmond ST | $1,449,000 | $657.14 | 4/3,0,1,0 | 2205/A | 2000/ASR | 8/26/2021 |
| SFR/D | 905 | Hillcrest ST | $1,798,000 | $615.96 | 5/2,2,0,0 | 2919/A | 1978/PUB | 8/25/2021 |
| SFR/D | 800 | McCarthy CT | $1,900,000 | $1,116.99 | 3/2,0,1,0 | 1701/A | 1952/ASR | 8/20/2021 |
| TPLX/A | 330 | Bungalow DR | $1,900,000 | $682.96 | 7/3,0,0,0 | 2782/A | 1958/ASR | 8/13/2021 |
| SFR/D | 929 | Sheldon ST | $2,375,000 | $854.01 | 4/3,0,1,0 | 2781/A | 2019/BLD | 8/20/2021 |
| SFR/D | 1218 E | Sycamore AVE | $2,700,000 | $651.54 | 4/3,0,0,1 | 4144/P | 1952/PUB | 8/25/2021 |