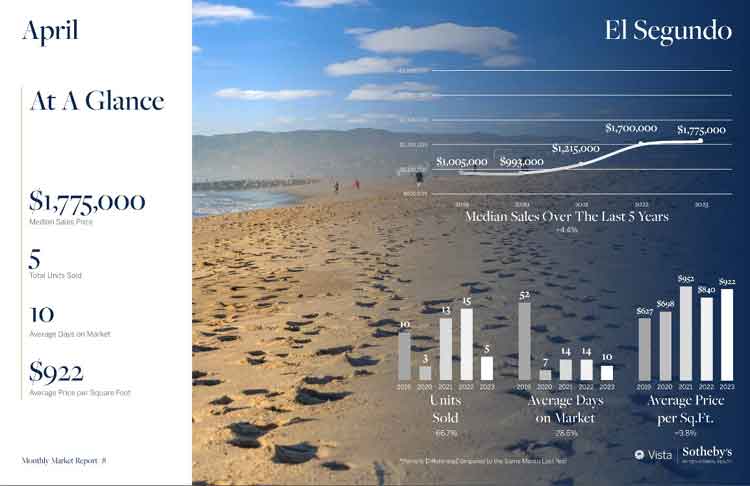
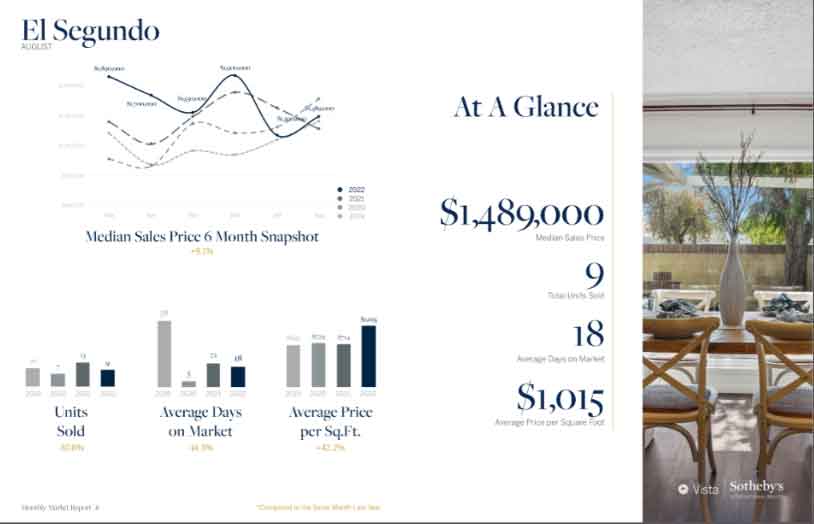
Welcome to the 2022 real estate market recap for El Segundo CA. Overall it was a fantastic year for both the number of home sales and the prices that they sold for.
There were 125 on market condo, townhome and home sales. The average list price was $1,547,732 with the average sold price at $1,551,098 meaning that homes generally sold at full price or higher. That did peak during the summer with the fall and winter months seeing that trend reverse and most homes selling below the listing price.
The average price per square foot was $891 and homes averaged 24 days on the market before going into escrow. Take a look at all of the homes that sold in El Segundo below.
The highest sale of the year was $3,900,000 for a large single family located at 639 W Oak Avenue. There were an impressive 5 homes that sold over $3.0M in El Segundo. The lowest price of the year was $400,000 for a 1 bedroom condo in Pacific Sands complex at 770 W Imperial Avenue #86.
2022 Home Sales and El Segundo Home Prices
| Type |
|
Address |
Sold Price |
$ Per Sq Ft |
Bed/Bath |
Sq Ft |
Age |
Sold Date |
| TWNHS/A |
607 E |
Pine AVE |
$950,000 |
$769.85 |
2/2,0,0,0 |
1234/A |
1984/ASR |
12/28/2022 |
| CONDO/A |
950 |
Virginia ST #202 |
$628,500 |
$534.44 |
2/2,0,0,0 |
1176/A |
1981/ASR |
12/23/2022 |
| TWNHS/A |
310 W |
Imperial AVE #1 |
$685,000 |
$493.16 |
2/2,0,1,0 |
1389/A |
1979/ASR |
12/14/2022 |
| TWNHS |
510 E |
Imperial AVE |
$1,300,000 |
$660.23 |
4/2,0,2,0 |
1969/ |
2019 |
12/6/2022 |
| SFR/D |
528 W |
Sycamore AVE |
$1,619,000 |
$923.56 |
4/2,0,0,0 |
1753/A |
1963/ASR |
12/6/2022 |
| TWNHS/A |
227 W |
Palm AVE #5 |
$895,000 |
$669.41 |
2/3,0,0,0 |
1337/A |
1981/APP |
11/29/2022 |
| CONDO |
950 |
Virginia ST #303 |
$684,000 |
$581.63 |
2/2,0,0,0 |
1176/A |
1981/ASR |
11/23/2022 |
| TWNHS |
1349 E |
GRAND AVE #F |
$1,065,000 |
$719.59 |
3/1,1,1,0 |
1480/ |
1989 |
11/23/2022 |
| CONDO/D |
818 |
Main ST #101 |
$859,000 |
$610.95 |
2/2,0,0,0 |
1406/A |
1979/ASR |
11/18/2022 |
| TWNHS/A |
311 |
Kansas ST #A |
$1,455,000 |
$699.52 |
4/3,0,1,0 |
2080/A |
2006/ASR |
11/7/2022 |
| SFR/D |
1514 E |
Maple AVE |
$1,875,000 |
$550.82 |
7/4,0,0,0 |
3404/A |
1962/PUB |
11/1/2022 |
| SFR/D |
423 |
Loma Vista ST |
$2,000,000 |
$1,278.77 |
3/2,0,0,0 |
1564/A |
1928/ASR |
10/27/2022 |
| SFR/D |
508 |
Lomita ST |
$1,385,000 |
$1,208.55 |
3/1,1,0,0 |
1146/A |
1958/ASR |
10/21/2022 |
| CONDO/A |
770 W |
Imperial AVE #72 |
$675,000 |
$671.64 |
2/2,0,0,0 |
1005/A |
1966/ASR |
10/20/2022 |
| CONDO/A |
950 |
Virginia ST #203 |
$675,000 |
$573.98 |
2/2,0,0,0 |
1176/A |
1981/ASR |
10/18/2022 |
| SFR/D |
845 |
Eucalyptus DR |
$1,585,000 |
$1,096.13 |
4/2,0,0,0 |
1446/A |
1949/ASR |
10/17/2022 |
| SFR/D |
522 |
Maryland ST |
$1,400,000 |
$1,637.43 |
2/1,0,0,0 |
855/A |
1955/ASR |
10/14/2022 |
| SFR/D |
1219 E |
Maple AVE |
$2,950,000 |
$713.08 |
4/3,0,2,0 |
4137/AP |
2002/ASR |
10/12/2022 |
| SFR/D |
636 |
Loma Vista ST |
$2,140,000 |
$1,066.27 |
3/2,0,1,0 |
2007/A |
1948/ASR |
10/11/2022 |
| SFR/D |
229 W |
Sycamore AVE |
$1,600,000 |
$959.81 |
3/3,0,0,0 |
1667/AP |
1949/ASR |
10/7/2022 |
| SFR/D |
639 W |
Oak AVE |
$3,900,000 |
$936.15 |
5/2,3,0,0 |
4166/A |
1951/PUB |
10/5/2022 |
| SFR/D |
714 |
Redwood AVE |
$1,565,000 |
$729.26 |
3/1,1,0,0 |
2146/A |
1979/ASR |
10/4/2022 |
| SFR/D |
614 |
Loma Vista ST |
$2,500,000 |
$1,758.09 |
3/2,0,0,0 |
1422/A |
1940/ASR |
10/3/2022 |
| TWNHS/A |
221 |
Whiting ST #2 |
$1,143,000 |
$678.34 |
3/2,1,1,0 |
1685/A |
1992/ASR |
9/29/2022 |
| SFR/D |
905 |
Dune ST |
$2,060,000 |
$861.92 |
4/3,0,0,0 |
2390/A |
1979/PUB |
9/27/2022 |
| CONDO/A |
215 W |
Palm AVE #102 |
$735,000 |
$647.01 |
2/2,0,0,0 |
1136/A |
1981/ASR |
9/22/2022 |
| DPLX/D |
423 W |
Maple AVE |
$1,771,500 |
$1,074.29 |
4/2,0,0,0 |
1649/A |
1912/ASR |
9/22/2022 |
| TWNHS |
535 E |
Walnut AVE #A |
$1,125,000 |
$697.46 |
2/2,0,1,0 |
1613/ |
1989 |
9/14/2022 |
| TWNHS/A |
1373 E |
Grand AVE #E |
$1,060,000 |
$716.22 |
3/2,0,1,0 |
1480/A |
1989/ASR |
9/8/2022 |
| CONDO/A |
745 |
Main ST #106 |
$750,000 |
$639.39 |
2/1,1,0,0 |
1173/A |
1977/ASR |
9/1/2022 |
| TPLX/D |
834 |
Penn ST |
$1,835,000 |
$1,023.42 |
4/3,0,0,0 |
1793/A |
1943/ASR |
9/1/2022 |
| SFR/D |
540 |
Richmond ST |
$2,200,000 |
$914.76 |
4/4,0,0,0 |
2405/A |
1988/ASR |
9/1/2022 |
| SFR/D |
813 |
Mccarthy CT |
$1,585,000 |
$1,261.94 |
3/1,0,1,0 |
1256/A |
1953/ASR |
8/31/2022 |
| SFR/D |
521 |
Loma Vista ST |
$1,455,000 |
$1,171.50 |
2/2,0,0,0 |
1242/A |
1964/ASR |
8/25/2022 |
| SFR/D |
602 |
Arena ST |
$1,489,000 |
$1,193.11 |
3/1,0,0,0 |
1248/A |
1926/ASR |
8/22/2022 |
| SFR/D |
722 |
Redwood AVE |
$2,021,095 |
$698.13 |
4/3,0,0,0 |
2895/AP |
1979/PUB |
8/19/2022 |
| SFR/D |
116 W |
Oak AVE |
$1,410,000 |
$1,214.47 |
2/1,0,0,0 |
1161/A |
1947/ASR |
8/12/2022 |
| SFR/D |
202 W |
Sycamore AVE |
$2,220,000 |
$1,737.09 |
3/1,0,0,0 |
1278/A |
1947/ASR |
8/11/2022 |
| TWNHS/A |
210 |
Whiting ST #G |
$1,315,000 |
$785.54 |
3/2,0,1,0 |
1674/A |
2003/ASR |
8/9/2022 |
| CONDO/A |
815 N |
Main ST #202 |
$800,000 |
$698.69 |
2/2,0,0,0 |
1145/A |
1983/ASR |
8/5/2022 |
| SFR/D |
522 |
California ST |
$1,984,000 |
$916.82 |
4/3,0,0,0 |
2164/A |
1952/ASR |
8/3/2022 |
| CONDO |
770 W |
IMPERIAL AVE #86 |
$400,000 |
$547.20 |
1/1,0,0,0 |
731/ |
1966 |
7/29/2022 |
| SFR/D |
1535 E |
Elm AVE |
$1,861,000 |
$966.75 |
3/2,0,0,0 |
1925/A |
1954/ASR |
7/28/2022 |
| TWNHS/A |
1700 E |
Mariposa AVE #3 |
$1,200,000 |
$710.06 |
3/3,0,0,0 |
1690/A |
2013/ASR |
7/26/2022 |
| CONDO/A |
770 W |
Imperial AVE #98 |
$442,500 |
$632.14 |
1/1,0,0,0 |
700/A |
1966/ASR |
7/22/2022 |
| SFR/D |
631 |
Center ST |
$2,800,000 |
$800.00 |
5/4,0,0,0 |
3500/A |
1943/PUB |
7/19/2022 |
| CONDO/A |
356 |
Virginia ST #201 |
$870,000 |
$718.41 |
2/2,0,0,0 |
1211/P |
1981/PUB |
7/12/2022 |
| SFR/D |
1204 E |
Walnut AVE |
$1,900,000 |
$1,027.03 |
3/2,0,0,0 |
1850/A |
1950/ASR |
7/12/2022 |
| TWNHS/A |
314 |
Penn ST #1 |
$1,107,000 |
$736.53 |
2/2,0,1,0 |
1503/A |
1992/ASR |
7/11/2022 |
| SFR/D |
325 W |
Walnut AVE |
$1,605,000 |
$802.10 |
4/2,0,0,0 |
2001/A |
1956/PUB |
7/8/2022 |
| CONDO/A |
301 |
kansas ST #C |
$1,300,000 |
$640.39 |
3/3,0,0,0 |
2030/P |
2006/SEE |
7/6/2022 |
| SFR/D |
417 W |
Mariposa AVE |
$1,505,115 |
$973.55 |
3/2,0,0,0 |
1546/A |
1940/ASR |
7/1/2022 |
| TWNHS/A |
1628 E |
Palm AVE #5 |
$950,000 |
$689.40 |
3/2,0,1,0 |
1378/A |
1992/ASR |
6/30/2022 |
| SFR/D |
1509 E |
Oak AVE |
$2,205,000 |
$1,364.48 |
3/2,0,0,0 |
1616/A |
1957/ASR |
6/30/2022 |
| TWNHS/A |
310 W |
Imperial AVE #4 |
$915,000 |
$687.45 |
2/1,1,1,0 |
1331/A |
1979/PUB |
6/27/2022 |
| SFR/D |
320 E |
Walnut AVE |
$1,475,000 |
$1,450.34 |
2/1,0,0,0 |
1017/A |
1956/ASR |
6/23/2022 |
| SFR/D |
420 |
Center ST |
$1,900,000 |
$908.66 |
4/2,0,0,0 |
2091/A |
1983/ASR |
6/23/2022 |
| SFR/D |
525 |
Bungalow DR |
$2,539,000 |
$1,222.44 |
3/3,0,0,0 |
2077/B |
1955/ASR |
6/23/2022 |
| CONDO/A |
738 |
Main ST #103 |
$845,000 |
$671.70 |
2/2,0,0,0 |
1258/A |
1979/ASR |
6/21/2022 |
| SFR/D |
311 W |
Oak AVE |
$2,300,000 |
$1,482.91 |
3/2,0,0,0 |
1551/A |
1933/ASR |
6/15/2022 |
| SFR/D |
1423 E |
Elm AVE |
$2,392,000 |
$1,375.50 |
4/3,0,0,0 |
1739/A |
1955/ASR |
6/3/2022 |
| TWNHS/A |
530 |
Sierra PL #5 |
$1,260,000 |
$741.61 |
3/2,0,1,0 |
1699/P |
1992/PUB |
5/27/2022 |
| SFR/D |
1429 E |
Mariposa AVE |
$1,585,000 |
$1,292.82 |
3/2,0,0,0 |
1226/A |
1953/ASR |
5/27/2022 |
| SFR/D |
759 |
Yucca ST |
$1,920,000 |
$906.09 |
4/1,1,1,0 |
2119/A |
1969/PUB |
5/27/2022 |
| TWNHS/A |
400 |
Richmond ST #2 |
$1,230,000 |
$881.72 |
3/2,0,1,0 |
1395/P |
1990/PUB |
5/24/2022 |
| SFR/D |
758 |
California ST |
$1,450,000 |
$1,131.05 |
3/1,0,0,0 |
1282/A |
1956/ASR |
5/24/2022 |
| CONDO/A |
770 W |
Imperial AVE #99 |
$450,000 |
$614.75 |
1/1,0,0,0 |
732/A |
1966/ASR |
5/19/2022 |
| CONDO/A |
227 E |
Oak AVE #301 |
$876,000 |
$666.16 |
2/2,0,0,0 |
1315/A |
1979/ASR |
5/18/2022 |
| CONDO/A |
123 E |
Oak AVE #207 |
$800,000 |
$636.94 |
2/2,0,0,0 |
1256/A |
1979/ASR |
5/17/2022 |
| SFR/D |
741 |
Bungalow DR |
$1,875,000 |
$1,298.48 |
3/2,0,0,0 |
1444/P |
1943/PUB |
5/17/2022 |
| SFR/D |
731 W |
sycamore AVE |
$1,915,000 |
$740.24 |
4/3,0,0,0 |
2587/P |
1979/PUB |
5/16/2022 |
| TWNHS/A |
1628 |
E Palm Ave #8 |
$975,000 |
$707.55 |
3/2,0,1,0 |
1378/A |
1992/ASR |
5/12/2022 |
| TWNHS/A |
572 E |
Imperial AVE |
$1,105,000 |
$870.08 |
2/2,0,1,0 |
1270/P |
2019/PUB |
5/12/2022 |
| SFR/D |
346 |
Valley ST |
$2,000,000 |
$940.73 |
3/3,0,0,0 |
2126/P |
1963/PUB |
5/12/2022 |
| SFR/D |
512 |
Lomita ST |
$1,740,000 |
$1,365.78 |
3/2,0,0,0 |
1274/P |
1962/PUB |
5/10/2022 |
| DPLX/D |
517 |
California ST |
$1,815,000 |
$1,058.93 |
3/2,0,0,0 |
1714/P |
1952/PUB |
5/9/2022 |
| SFR/D |
935 |
Cypress ST |
$2,600,000 |
$770.37 |
5/2,2,0,0 |
3375/E |
2022/EST |
5/9/2022 |
| SFR/D |
647 W |
Maple AVE |
$1,450,000 |
$714.29 |
3/2,0,0,0 |
2030/A |
1925/ASR |
5/6/2022 |
| SFR/D |
821 |
Sheldon ST |
$2,254,000 |
$1,188.82 |
4/2,0,0,0 |
1896/A |
1963/ASR |
5/6/2022 |
| SFR/D |
537 |
Richmond ST |
$2,650,000 |
$863.75 |
4/5,0,0,0 |
3068/A |
2018/ASR |
5/4/2022 |
| TWNHS/A |
303 |
Kansas ST #D |
$1,475,000 |
$709.13 |
4/3,0,1,0 |
2080/A |
2006/PUB |
5/3/2022 |
| TWNHS |
532 E |
IMPERIAL AVE |
$1,030,000 |
$828.64 |
2/3,0,0,0 |
1243/A |
2019 |
4/28/2022 |
| SFR/D |
514 |
Sheldon ST |
$3,150,000 |
$1,032.11 |
4/4,0,0,0 |
3052/O |
2006/ASR |
4/28/2022 |
| TWNHS/A |
1313 E |
Grand AVE #D |
$1,175,000 |
$793.92 |
3/2,0,1,0 |
1480/A |
1989/ASR |
4/26/2022 |
| TWNHS/A |
548 E |
Imperial AVE |
$1,300,000 |
$684.21 |
4/3,0,1,0 |
1900/A |
2019/PUB |
4/20/2022 |
| SFR/D |
424 |
Bungalow DR |
$1,865,000 |
$840.09 |
3/2,0,1,0 |
2220/A |
1989/ASR |
4/20/2022 |
| CONDO/A |
900 |
cedar ST #111 |
$830,000 |
$705.18 |
2/2,0,0,0 |
1177/P |
1978/PUB |
4/19/2022 |
| SFR/D |
912 |
Mccarthy CT |
$1,600,000 |
$1,049.87 |
3/2,0,0,0 |
1524/A |
1953/ASR |
4/14/2022 |
| SFR |
654 W |
ACACIA AVE |
$2,139,000 |
$724.35 |
5/3,0,0,0 |
2953/ |
1987 |
4/11/2022 |
| SFR/D |
715 W |
Oak AVE |
$1,670,000 |
$960.32 |
3/2,0,0,0 |
1739/A |
1960/ASR |
4/7/2022 |
| SFR/D |
511 |
Hillcrest ST |
$2,400,000 |
$836.53 |
5/3,0,1,0 |
2869/A |
1988/PUB |
4/5/2022 |
| TWNHS/A |
210 |
Whiting ST #C |
$1,410,000 |
$813.15 |
3/3,0,1,0 |
1734/A |
2003/ASR |
4/4/2022 |
| SFR/D |
355 |
Hillcrest ST |
$2,240,000 |
$856.27 |
5/3,0,0,0 |
2616/P |
1963/PUB |
4/4/2022 |
| SFR/D |
519 |
Standard ST |
$2,249,000 |
$743.23 |
5/3,0,0,0 |
3026/A |
1959/ASR |
4/4/2022 |
| SFR/D |
1502 E |
Oak AVE |
$3,025,000 |
$715.81 |
4/4,0,1,0 |
4226/A |
1997/ASR |
4/4/2022 |
| SFR/D |
1205 E |
Oak AVE |
$1,700,000 |
$1,278.20 |
3/1,0,1,0 |
1330/A |
1955/ASR |
4/1/2022 |
| SFR/D |
753 |
Maryland ST |
$2,350,000 |
$798.50 |
4/3,0,0,0 |
2943/P |
1942/PUB |
3/29/2022 |
| SFR |
905 |
MCCARTHY CT |
$3,425,000 |
$822.72 |
4/4,0,0,0 |
4163/ |
1952 |
3/29/2022 |
| SFR/D |
641 |
Center ST |
$1,540,000 |
$1,400.00 |
3/1,0,0,0 |
1100/O |
1943/ASR |
3/25/2022 |
| SFR/D |
612 |
California ST |
$2,200,000 |
$1,184.71 |
3/2,0,0,0 |
1857/A |
1952/ASR |
3/24/2022 |
| CONDO/A |
770 W |
Imperial AVE #13 |
$672,500 |
$723.12 |
2/2,0,0,0 |
930/A |
1966/PUB |
3/17/2022 |
| SFR |
876 |
CENTER ST |
$2,050,000 |
$1,000.00 |
3/2,0,0,0 |
2050/ |
1954 |
3/16/2022 |
| SFR/D |
705 W |
Mariposa AVE |
$1,299,000 |
$1,496.54 |
2/2,0,0,0 |
868/A |
1922/PUB |
3/11/2022 |
| CONDO/A |
950 |
Main ST #208 |
$798,000 |
$679.15 |
2/1,1,0,0 |
1175/A |
1982/ASR |
3/10/2022 |
| CONDO/A |
815 |
Main ST #303 |
$790,000 |
$689.96 |
2/2,0,0,0 |
1145/A |
1983/ASR |
3/9/2022 |
| DPLX/D |
517 |
Maryland ST |
$1,925,000 |
$1,005.22 |
4/3,0,0,0 |
1915/A |
1956/OTH |
3/9/2022 |
| SFR/D |
1220 E |
Acacia AVE |
$1,890,000 |
$1,176.10 |
3/2,0,0,0 |
1607/A |
1949/ASR |
3/2/2022 |
| CONDO/A |
945 |
Pepper ST #209 |
$685,000 |
$582.98 |
2/2,0,0,0 |
1175/A |
1982/ASR |
2/28/2022 |
| TWNHS/A |
605 E |
Pine AVE |
$1,000,000 |
$810.37 |
2/2,0,0,0 |
1234/A |
1984/ASR |
2/25/2022 |
| CONDO |
950 |
Main ST #301 |
$799,000 |
$680.00 |
2/2,0,0,0 |
1175/ |
1982 |
2/23/2022 |
| TWNHS |
1349 E |
Grand AVE #E |
$1,100,000 |
$811.21 |
3/1,1,1,0 |
1356/ |
1989 |
2/23/2022 |
| CONDO/A |
950 |
Virginia ST #204 |
$720,000 |
$612.24 |
2/2,0,0,0 |
1176/A |
1981/ASR |
2/18/2022 |
| SFR/D |
526 |
Whiting ST |
$2,295,000 |
$877.96 |
5/2,0,1,0 |
2614/A |
1912/PUB |
2/18/2022 |
| TWNHS/A |
311 |
Kansas ST #F |
$1,300,000 |
$640.39 |
3/2,0,1,0 |
2030/P |
2006/PUB |
2/14/2022 |
| SFR/D |
721 |
Bayonne ST |
$1,210,000 |
$1,774.19 |
2/1,0,0,0 |
682/A |
1918/PUB |
2/11/2022 |
| TWNHS/D |
337 |
Penn ST |
$1,525,000 |
$747.92 |
4/3,0,1,0 |
2039/P |
2021/PUB |
2/10/2022 |
| TWNHS |
1225 E |
Grand AVE #H |
$1,170,000 |
$661.02 |
2/2,0,1,0 |
1770/ |
2006 |
1/26/2022 |
| TWNHS/A |
1700 E |
Mariposa AVE #2 |
$1,245,000 |
$773.29 |
3/2,0,1,0 |
1610/A |
2013/PUB |
1/25/2022 |
| SFR/D |
360 |
Hillcrest ST |
$3,100,000 |
$686.14 |
4/4,0,0,0 |
4518/A |
1991/PUB |
1/25/2022 |
| SFR/D |
717 |
Virginia ST |
$2,200,000 |
$804.98 |
3/2,1,0,0 |
2733/A |
1914/ASR |
1/24/2022 |
| CONDO/A |
770 W |
Imperial AVE #49 |
$580,000 |
$577.11 |
2/2,0,0,0 |
1005/P |
1966/PUB |
1/20/2022 |
| SFR |
1428 E |
Elm AVE |
$1,780,000 |
$1,220.85 |
3/3,0,0,0 |
1458/ |
1954/ASR |
1/13/2022 |
| TWNHS/A |
216 |
Loma Vista ST #C |
$1,035,000 |
$727.34 |
3/3,0,0,0 |
1423/P |
1990/PUB |
1/12/2022 |
| TWNHS |
1225 E |
Grand AVE #F |
$1,060,000 |
$675.16 |
2/2,0,0,0 |
1570/ |
2006 |
1/11/2022 |
| TWNHS/A |
215 |
Whiting ST #3 |
$1,075,000 |
$691.32 |
3/3,0,1,0 |
1555/A |
1992/ASR |
1/4/2022 |
